20:00
Day Two:
Infrastructures
~20 min
Overview
Questions
Lesson Objectives
To be able to
- Describe the difference from a library and a package, in R.
- Create a project powered by renv
- Use
?renv::init,?renv::status,?renv::snapshot, and?renv::restore
Local environments - {renv}
Glossary
Package: a container for functions and data
Library: a folder on a computer in which installed packages are stored
Repository: a source of packages (often on Internet)
Reminder
Functions and data are identified by their names (which cannot be duplicate within the same package).
When you library() a package you attach it to the current R session.
Attaching a package to the R session, it means to make it function and data names available for you to use. I.e., you are (within the session) expanded the language!
Repositories [optional]
The most common repository is CRAN (The Comprehensive R Archive Network) from which you can install packages from any R session by install.packages().
Other repositories are:
- Bioconductor: focused on open source software for bioinformatics.
- Posit Public Package Manager: current and snapshot versions of R and Python packages.
- R Universe: high-performance package server which turns GitHub organizations into repositories.
Libraries [optional]
System: shared across all users and projects
User: shared by all the user projects
Project: powered by renv, is the project its own independent collection of packages
Tip
Call .libPaths() to know which library are you using in the session you are.
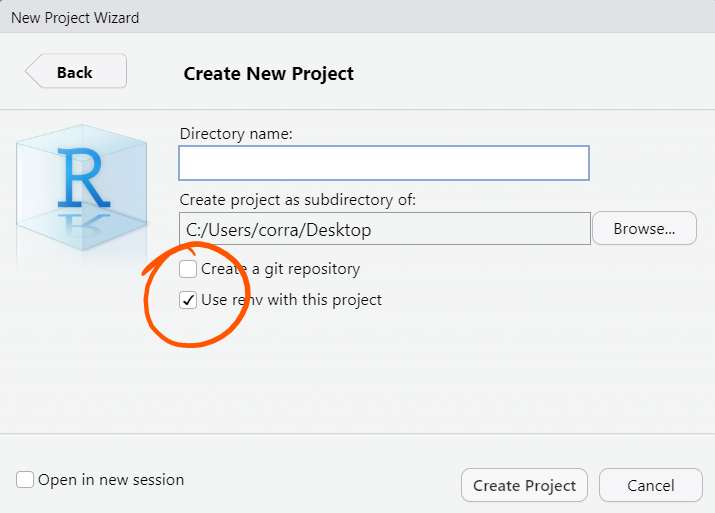
Create projects powered by {renv} [side]
To create a project powered by renv you can simply tick the corresponding option in RStudio at creation time.

The {renv} main workflow

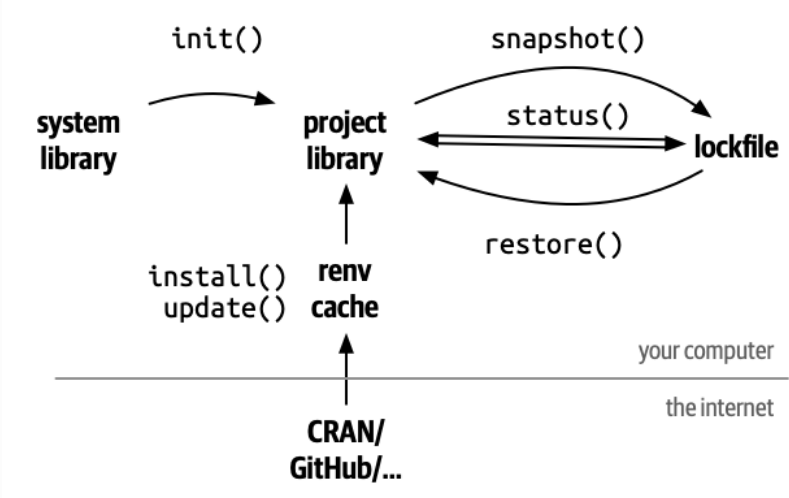
The renv workflow
-
init(): setup the renv infrastructure -
install()/update()/install.packages(): install/update packages -
snapshot(): update therenv.lockfile writing metadata about the current state of the project library -
restore(): restore the library accordingly to the what is prescribed in therenv.lockfile
status(): check for differences between therenv.lockfile and the packages installed in the project library.
Convert projects to use {renv}
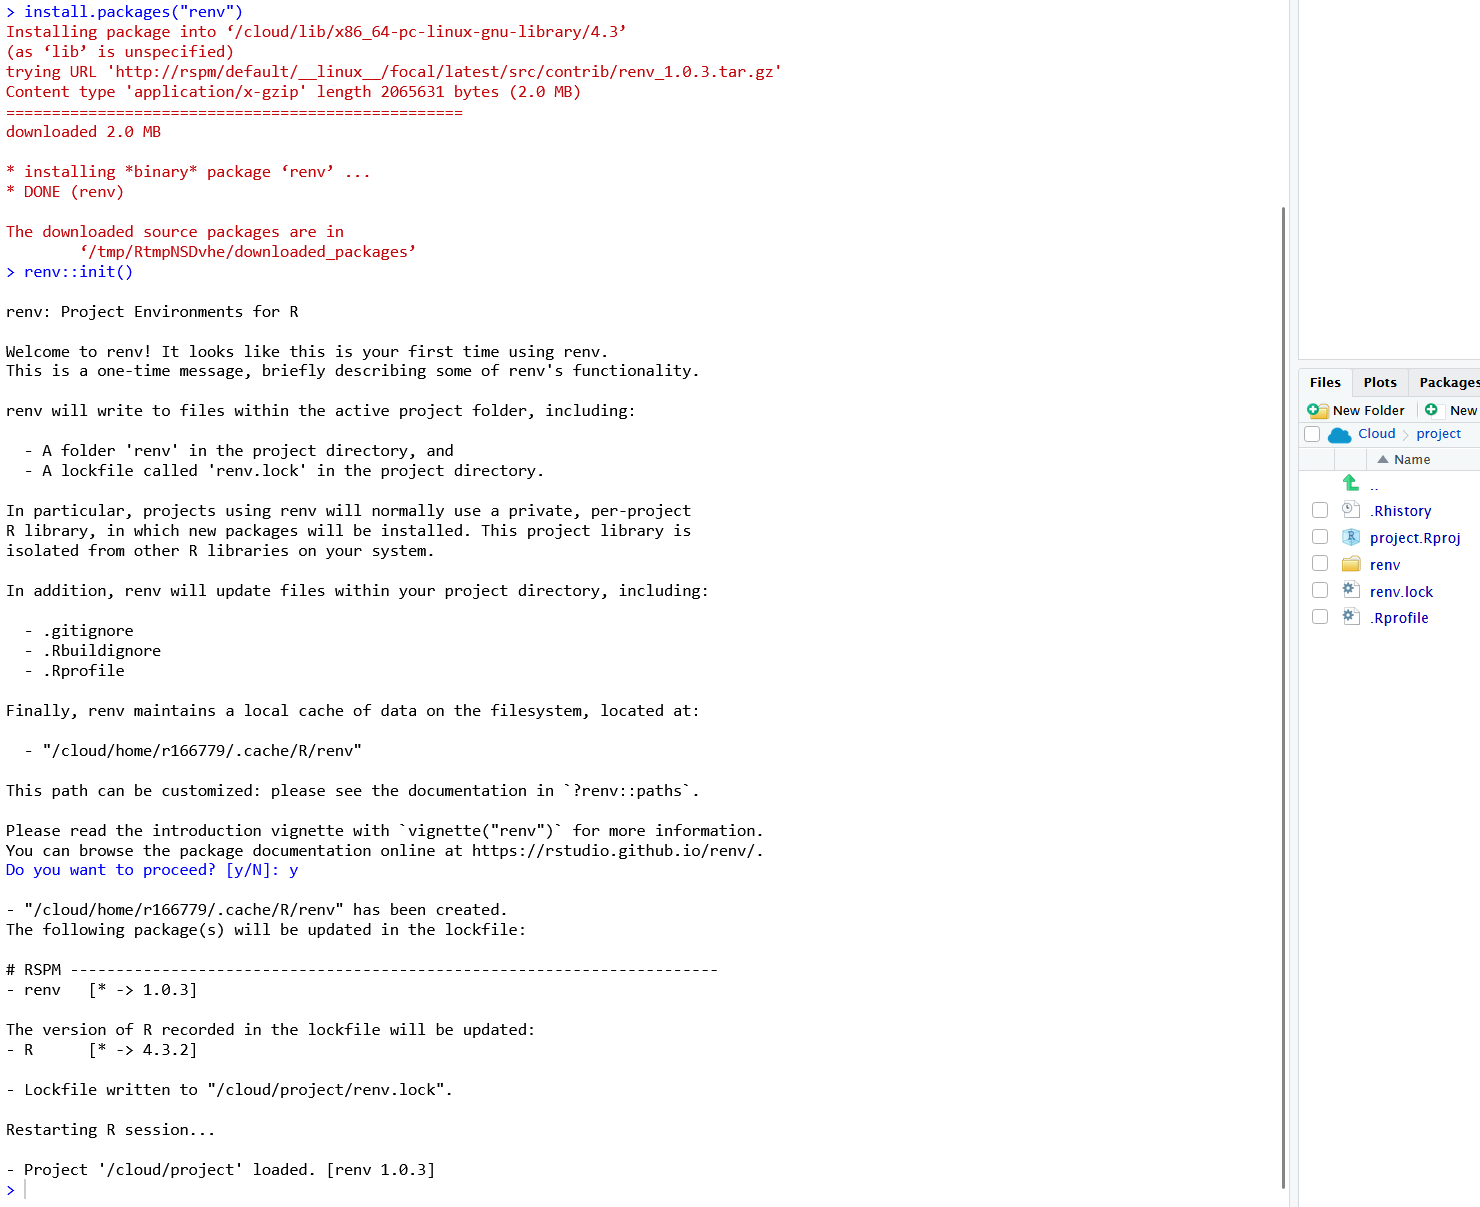
To convert an existing project to use renv call renv::init().
This creates:
A
renv/libraryfolder that will be the projects library containing all the packages used within the projectrenv.lockfile which is the current package inventory of your projects, storing metadata of project used packages so that anyone can re-install them all (with exact the same version) on any other machine.A project dedicated
.Rprofile; which is an R script that is automatically run at every R start, just before to giving you the power to interact with the R session, and it is used by renv to configure the project library in the current session.

My turn
ME: Connect to the course-scripts project in RStudio cloud (https://bit.ly/ubep-rws-rstudio): script
06-renv.R
{renv} cache [optional]
Every renv projects starts with an empty library (there is only the renv package itself).
Working on many projects you will probably use same packages on different projects, so you will need to install them multiple times!
Important
Installing a package means:
- download it from a repository
- install (put) it in the project library
every time…
That is managed efficiently by a renv global cache, which permit to download and install a specific package (with a specific version) only once, so that installing the same package on multiple projects takes time only the first time, and it will be lighting fast in all the subsequent ones.
Your turn (main: A; bk1: B; bk2: C)
Connect to our pad (https://bit.ly/ubep-rws-pad-ed3) (Ex. 6)
Connect to Day 2 project on our RStudio cloud (https://bit.ly/ubep-rws-rstudio)
Your turn
- Create a new project
- Install renv and activate it
- Install ggplot2, and here and update the
renv.lockfile - Create the folders
R/,analyses/, andoutput/ - Create a script
R/functions.Rand define a functionmake_plot()returning aggplot2plot ofmtcars - Create a script
analyses/analysis.Rthat: - attach the
ggplot2package - attach the
herepackage - attach the
functions.Rscript - calls the
make_plot()function - saves the plot in the
output/folder - Run the whole
analyses/analysis.Rscript. - Answer the question reported in the pad (https://bit.ly/ubep-rws-pad-ed3).
status(): check differences between renv.lock and packages installed in the project’s library.
My turn
YOU: Connect to our pad (https://bit.ly/ubep-rws-pad-ed3) and write there questions & doubts (and if I am too slow or too fast)
Acknowledgment
To create the current lesson, we explored, used, and adapted content from the following resources:
{renv}website.
The slides are made using Posit’s Quarto open-source scientific and technical publishing system powered in R by Yihui Xie’s Kintr.
Additional resources
License
This work by Corrado Lanera, Ileana Baldi, and Dario Gregori is licensed under CC BY 4.0

UBEP’s R training for supervisors