Day Four:
Finale
50 min approx
Tidyverse
-
library(tidyverse)wrapper for many packages:-
library(tidyr): reshape to tidy (pivot_longer,pivot_wider,separate) -
library(dplyr): data wrangling (filter,select,mutate,group_by,summarise) -
library(forcats): factors manipulation (fct_*) -
library(lubridate): dates manipulation (ymd,mdy,dmy,ymd_hms) -
library(stringr): string manipulation (str_*) -
library(ggplot2): data visualization
-
Tidy principles:
- design for humans
- pipes: “and then… and then…”
- tidy data
- functions are verbs
- coherent grammar
Project organizatin
- activate RStudio project
-
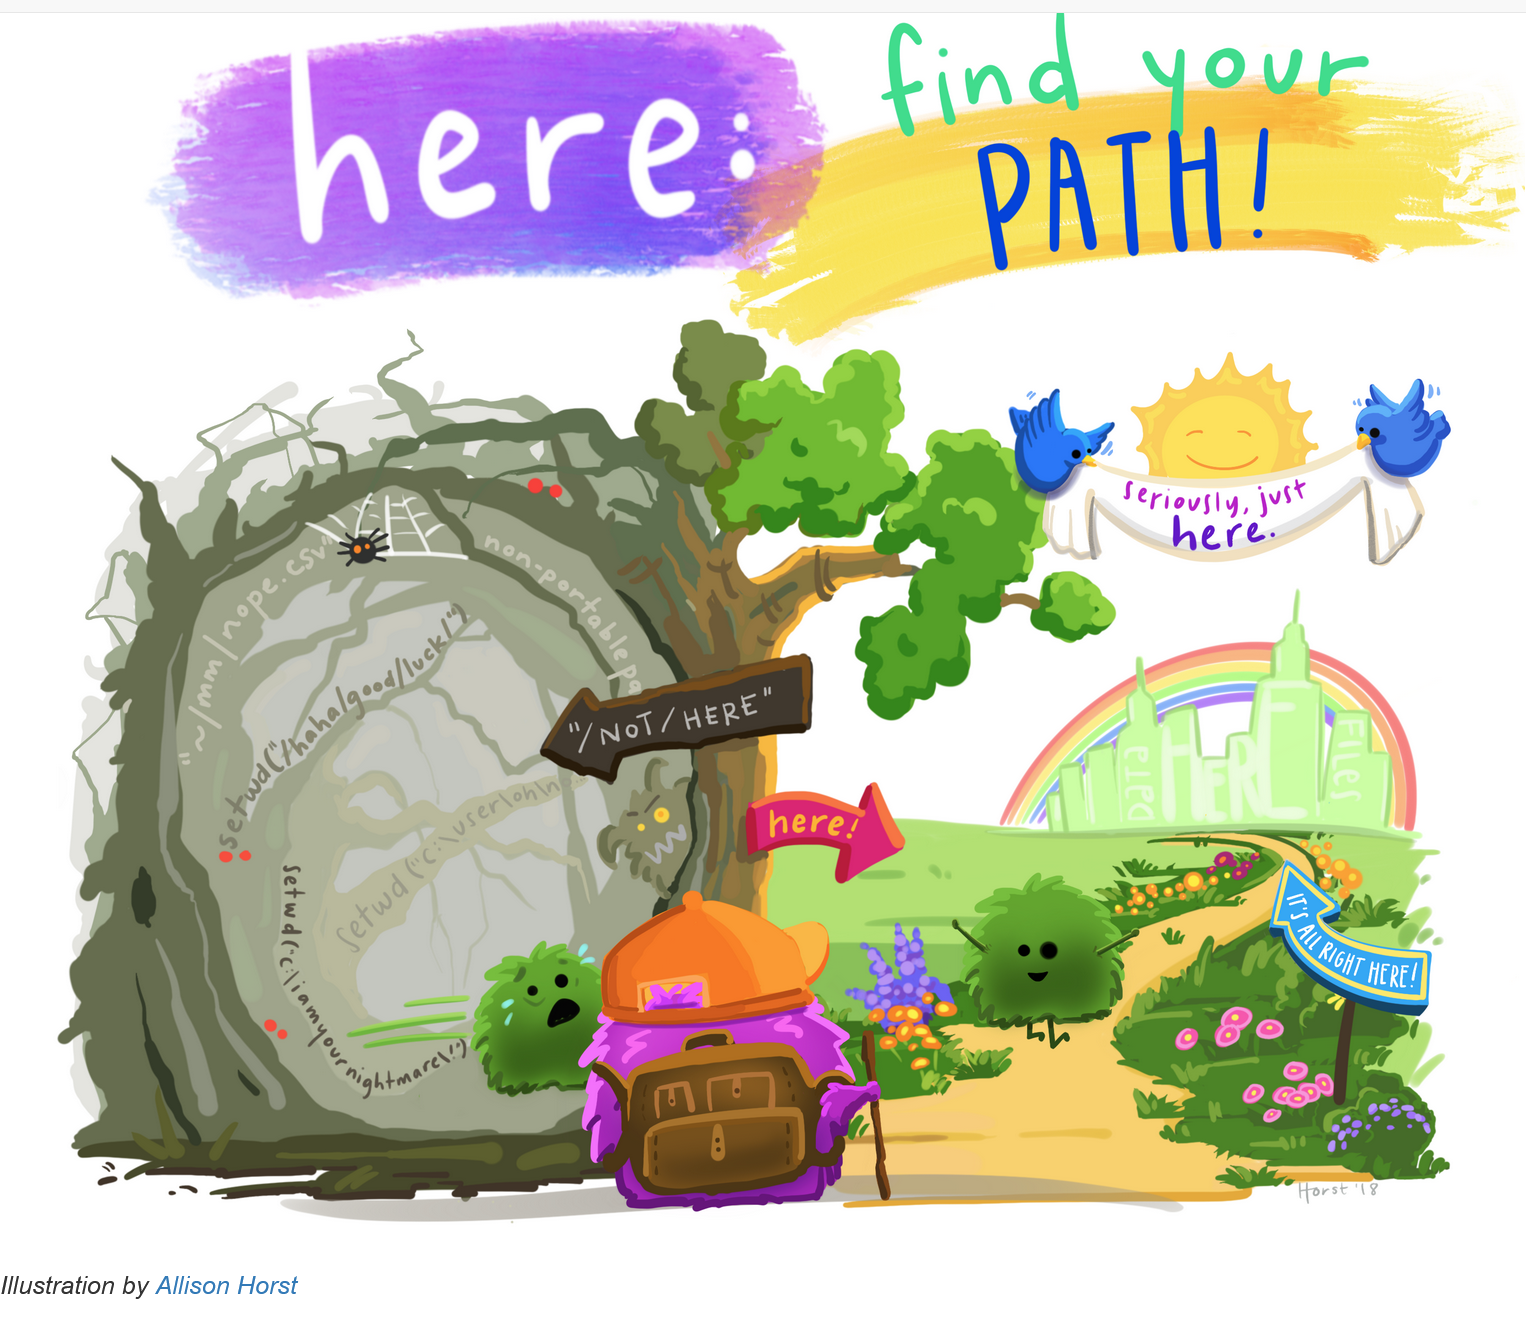
here::here(): project root -
here::here("data-raw"): raw data -
here::here("data"): preprocessed data -
here::here("output"): output -
here::here("R/functions.R"): script with custom functions -
here::here("analyses"): analyses - load custom functions with:
source(here("R/functions.R"))
Import
- (base):
read.csv - (tidyverse):
read_csv - (heven):
read_sas,read_spss,read_stata -
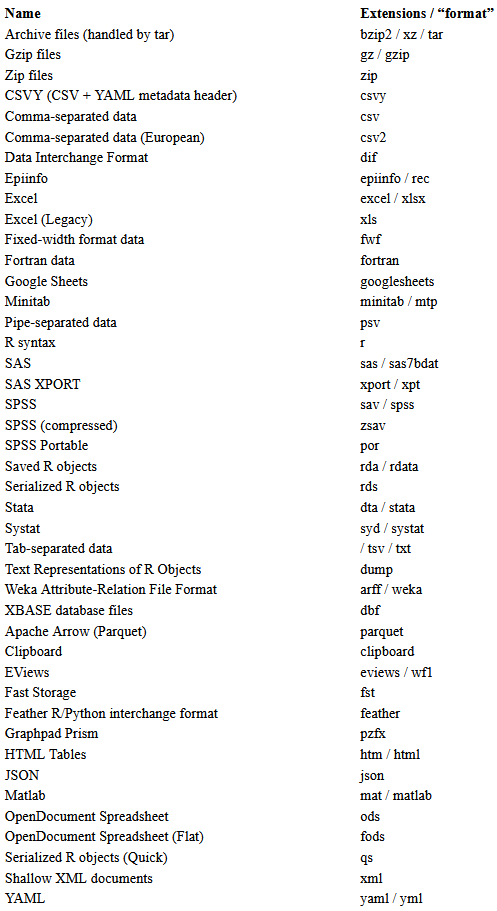
rio::import: import from many formats -
rio::export: export to many formats
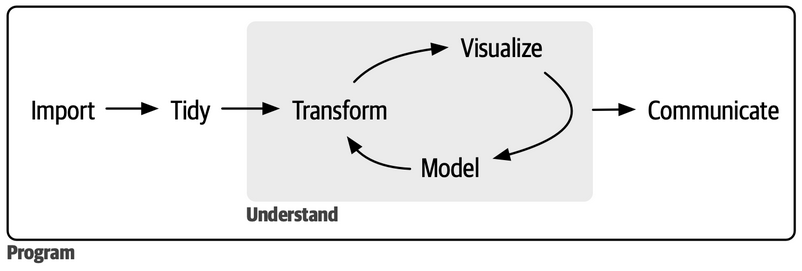
Data visualization
p <- <DATA> |>
  ggplot(
    aes(<GLOBAL_MAPPINGS>)
  ) +
    <GEOM_FUNCTION>(
      aes(<LOCAL_MAPPINGS>),
      position = <LOCAL_POSITION>,
      <AESTHETIC> = <LOCAL_CONSTANT>
    ) +
    <SCALE_FUNCTION> +
    <FACET_FUNCTION> +
    labs(
      ## aesthetics
      <AES_NAME> = "<TEXT>",

      ## meta-data
      <METADATA_NAME> = "<TEXT>"
    ) +
    <THEME>()

p
ggsave("my_plot.png") # last printet plot
ggsave("my_plot.jpeg", p) # specific plot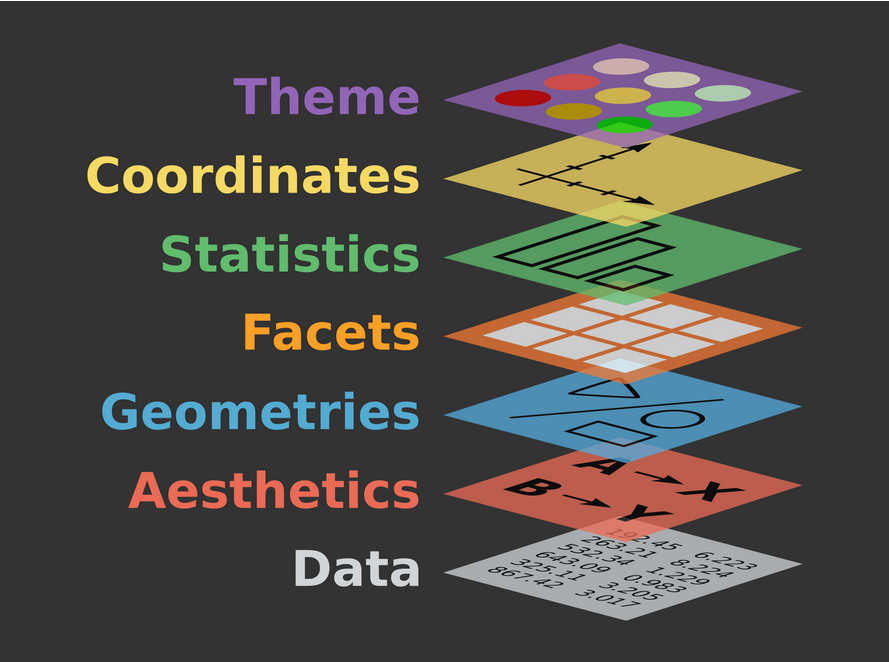
Next month(s) assessment - 10’
One month after the end of all the three editions of the course, we will upload a new complete assessment to the website to permit you to check long-term retention of the concepts and skills learned during the course.
Acknowledgment
The slides are made using Posit’s Quarto open-source scientific and technical publishing system powered in R by Yihui Xie’s Kintr.
License
This work by Corrado Lanera, Ileana Baldi, and Dario Gregori is licensed under CC BY 4.0![]()
![]()