Day Four:
Pipe(s)
and
Visualization

105 min approx

Overview

Questions

  • What is a ggplot, and what are its main components?
  • How should data be provided to a ggplot?
  • How can we create ggplots with the ggplot2 R package?
  • What are aesthetics, geometries, facets, plot themes and labs?

Lesson Objectives

To be able to

  • Create basic plots with ggplot2.
  • Use the facet_* functions to stratify plots according to data.
  • Modify the main style component of a plot (i.e., sub-/titles, labels, legends)
  • Save a plot as a stand-alone image file.

{ggplot2}

The R Layered Grammar of Graphics

Preamble: Pipes in composing plots

In the next section we will learn how to create plots with ggplot2.

We will create plots progressively adding what we will call layers of the plot.

For ggplot2 plots composition only, we have a dedicated pipe that is the plus sign +, reminding that we are adding elements.

Tip

Functions in ggplot2 are nouns and not verbs, exactly because we (sequentially) add them to the plot we are creating!1

Setup

First of all setup our environment for this lesson, and load some data.1

The Data

On November 14th 2006 the director of a high school in Greater Copenhagen, Denmark, contacted the regional public health authorities to inform them about an outbreak of diarrhoea and vomiting among participants from a school dinner party held on the 11th of November 2006. Almost all students and teachers of the school (750 people) attended the party.2

library(tidyverse)
library(here)
library(rio)

linelist <- here("data-raw/Copenhagen_clean.xlsx") |> 
  import() |> 
  mutate(across(where(is.character), fct))

head(linelist) # for slides, first 6 obs only.

Definitions:1 Tidy data.

  • A variable is a quantity, quality, or property that you can measure.

  • A value is the state of a variable when you measure it. The value of a variable may change from measurement to measurement.

  • An observation is a set of measurements made under similar conditions (you usually make all of the measurements in an observation at the same time and on the same object). An observation will contain several values, each associated with a different variable. We’ll sometimes refer to an observation as a data point.

Tabular data is a set of values, each associated with a variable and an observation.

In the next lessons, we will focus more on this, including how to convert non tidy dataset in tidy ones!

Important

Tabular data is tidy if:

  • Each value is placed in its own “cell”.
  • Each variable in its own column.
  • Each observation in its own row.

Why a Layered Grammar for Graphics

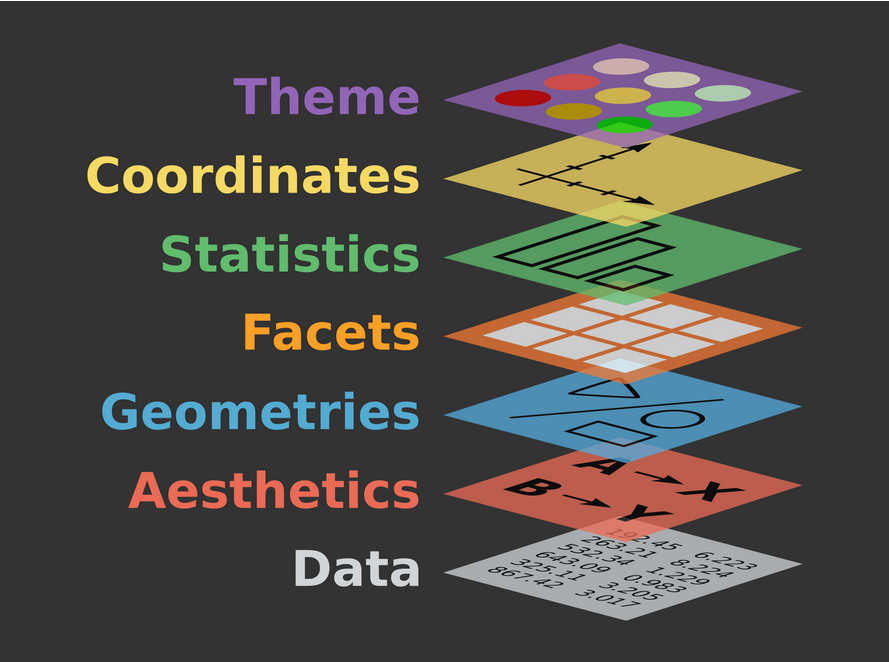
Using the ggplot2 system to create graphs, we won’t need to learn all the commands to produce every plot but we can learn a single system, a grammar, that will make us able to produce quite every kind of graph.

ggplot2 will allow us to build graphs by:

  1. plot information in our data

  2. mapping each of them to the aesthetics of our choice (e.g., x, y, colors)

  3. using the geometrical representation we need (e.g., points, lines, bars)

  4. after having possibly transformed them by some statistics

  5. accordingly to possibly different coordinate systems (e.g., polar)

  6. maybe stratifying the plot for some information in the data itself

  7. and customize its theme with regard to our stylistic needs and metadata (e.g., title, labels, …)

Important

By learning the grammar to control these 7 components, we can build quite any kind of graph using quite any kind of customization.

Tip

We will rarely need to use all these components. In this course, we will provide the basis for 1-3 (required to _have_ a plot), 6, and 7, while we will only mention at 4 and 5.

The practical aim of the lesson

ggplot plots components (side-by-side)

Image adapted from Grammar of Graphics

1. Data

Each part of the plot will be build using a single variable in our data, so that we can build the plot up the data we have, and, on the other side, we can control any part of the plot by our data.

ggplot(linelist)

Important

All the ggplot2 plots start from tabular data, calling ggplot on them.

Tip

Calling ggplot on data provide a white canvas to start building the plot.

1. Data

Each part of the plot will be build using a single variable in our data, so that we can build the plot up the data we have, and, on the other side, we can control any part of the plot by our data.

linelist |>  # start from data, and than...
  ggplot()  # create a plot

Important

All the ggplot2 plots start from tabular data, calling ggplot on them.

Tip

Calling ggplot on data provide a white canvas to start building the plot.

2. Aesthetics

Let’s say we want to investigate the distribution of the onset time. We should map the onset_datetime variable to the x axis!

linelist |>  # start from data, and than 
  ggplot(  # create a plot
    aes(  # with aesthetics:
      x = onset_datetime
    )
  )

Important

The aes function maps variables to aesthetics of our plot.

Main aesthetics (overview)

Important

You use aesthetics for visualize the data.

  • x, y: position along the x and y axes.

  • alpha: the transparency of the geometries.

  • colour: the color of the geometries according to the data.

  • fill: the interior color of the geometries.

  • group: to which group a geometry belongs.

  • linetype: the type of line used (solid, dotted, etc.).

  • shape: the shape of the points.

  • size: the size of the points or lines.
3. Geometries

Once having the canvas and the mappings, we can add a geometrical layer. In this case, we what to add bars for onset_datetime (i.e., x).

linelist |>  # start from data, and than 
  ggplot(  # create a plot
    aes(  # with aesthetics:
      x = onset_datetime
    )
  ) + 
  geom_bar() # drawing bars

Tip

In the help description of each geom_* there are the required aesthetics that it needs to be used.

Important

All geometry functions are called geom_*, with * indicating the type of geometry:

?geom_point, ?geom_line, ?geom_bar, ?geom_boxplot, ?gome_histogram, …

Main geom_*etries (overview)

Important

You use geom_*etries for shape the data.

  • geom_point: scatter-plot

  • geom_line: lines connecting points

  • geom_smooth: function line based on data

  • geom_boxplot: box plot for categorical variables

  • geom_bar: bar charts for categorical x axis

  • geom_histogram: histogram for continuous x axis

  • geom_violin: distribution kernel of data dispersion

  • geom_path: lines connecting points in sequence of appearance

aesthetic mapping vs aesthetics parameters?

Suppose we would like to have the bars filled in blue.

Why this produces red bars, and the legend report “fill” as header and “blue” as level?

linelist |>  # start from data, and than 
  ggplot(  # create a plot
    aes(  # with aesthetics:
      x = onset_datetime,
      fill = "blue"
    )
  ) + 
  geom_bar()

aesthetic mapping vs aesthetics parameters!

Suppose we would like to have the bars filled in blue.

Why this produces blue bars, and there is no legend?

linelist |>  # start from data, and than 
  ggplot(  # create a plot
    aes(  # with aesthetics:
      x = onset_datetime
    )
  ) + 
  geom_bar(fill = "blue")

Important

For having a blue bar chart, put the parameter within the geom_*etry call, and out of the aes call: these are parameters used to set aesthetics to a fixed value, like colour = "red" or size = 3, instead of mapping data to the aesthetics!

Multiple geom_*etries

We can also add multiple geom_*etries one on top of the others. In which case, it could be useful to set personalized aesthetics and customized the position of the geoms.

linelist |>  # start from data, and than 
  ggplot(  # create a plot
    aes(  # with aesthetics:
      x = onset_datetime
    )
  ) + 
  geom_bar(fill = "blue") +
  geom_bar(
    aes(fill = sex),
    position = "dodge"
  )

Tip

We can set also aesthetics within a single geom_* without affecting the other.

Important

We would like to also set the position of the geom_* we are creating.

Multiple geom_*etries

We can also add multiple geom_*etries one on top of the others. In which case, it could be useful to set personalized aesthetics and customized the position of the geoms.

linelist |>  # start from data, and than 
  ggplot(  # create a plot
    aes(  # with aesthetics:
      x = onset_datetime
    )
  ) + 
  geom_bar(
    aes(fill = sex),
    position = "dodge"
  )
  geom_bar(fill = "blue")

Important

geom_*s are added in order, so the operation is NOT commutative!

Main positions (overview)

Important

You use positions for place the geom_*s.

  • "stack": (default) multiple bars occupying the same x position will be stacked atop one another.

  • "dodge": dodged side-to-side.

  • "fill": shows relative proportions at each x by stacking the bars and then standardizing each bar to have the same height.

  • "jitter": adds random noise to a plot making it easier to read, sometimes.

Base template

Up to now, we can have a minimal set of instructions to define a base template for our plots.

<DATA> |> 
  ggplot(
    aes(<GLOBAL_MAPPINGS>)
  ) + 
    <GEOM_FUNCTION>(
      aes(<LOCAL_MAPPINGS>)
    )

Base template (+ optionals)

Up to now, we can have a minimal set of instructions to define a base template for our plots.

<DATA> |> 
  ggplot(
    aes(<GLOBAL_MAPPINGS>)
  ) + 
    <GEOM_FUNCTION>(
      aes(<LOCAL_MAPPINGS>),
      position = <LOCAL_POSITION>, # optional
      <AESTHETIC> = <LOCAL_CONSTANT> # optional
    )

Important

Local aesthetic mappings overwrite the global ones!

Your turn (main: A; bk1: B; bk2: C)

Your turn

  1. Open the script 18-ggplot.R and follow the instruction step by step to create a plot and upload it on the pad.
25:00

My turn

YOU: Connect to our pad (https://bit.ly/ubep-rws-pad-ed3) and write there questions & doubts (and if I am too slow or too fast)

ME: Connect to the course-scripts project in RStudio cloud (https://bit.ly/ubep-rws-rstudio): script 07-ggplot.R (up to base)

Break

10:00

Scales (overview)

Scales control the mapping from data to aesthetics. They are required to have a plot, but they are often set automatically. We can customize them to have a better control on the plot.

linelist |>  # start from data, and than 
  ggplot(  # create a plot
    aes(  # with aesthetics:
      x = onset_datetime
    )
  ) + 
  geom_bar(fill = "blue") +
  geom_bar(
    aes(fill = sex),
    position = "dodge"
  ) + 
  scale_x_datetime(
    date_breaks = "12 hours", 
    labels = scales::label_date_short()
  ) +
  scale_y_continuous(
    breaks = scales::breaks_pretty()
  )

Important

Scales names are composed as scale_<aes>_<type>, where <aes> is the aesthetic, and <type> is the type of scale.

see ?scale_y_continuous, and ?scale_x_datetime.

Tip

Package scales provides a set of functions to customize scales. We used label_date_short and breaks_pretty to have a better control on the labels and breaks.

Facets (overview)

We can then stratify our plot by the levels of one or two discrete data in our data set, creating distinct plot with the data for each class, displayed in distinct facets..

linelist |>  # start from data, and than 
  ggplot(  # create a plot
    aes(  # with aesthetics:
      x = onset_datetime
    )
  ) + 
  geom_bar(fill = "blue") +
  geom_bar(
    aes(fill = sex),
    position = "dodge"
  ) + 
  scale_x_datetime(
    date_breaks = "12 hours", 
    labels = scales::label_date_short()
  ) +
  scale_y_continuous(
    breaks = scales::breaks_pretty()
  ) +
  facet_grid(
    group ~ class
  )

Important

facet_grid forms a matrix of panels defined by row and column faceting variables.

Tip

facet_grid is most useful when you have two discrete variables, and all combinations of the variables exist in the data. If you have only one variable with many levels, try ?facet_wrap.

Facets (overview)

We can then stratify our plot by the levels of one or two discrete data in our data set, creating distinct plot with the data for each class, displayed in distinct facets..

linelist |>  # start from data, and than 
  ggplot(  # create a plot
    aes(  # with aesthetics:
      x = onset_datetime
    )
  ) + 
  geom_bar(fill = "blue") +
  geom_bar(
    aes(fill = sex),
    position = "dodge"
  ) + 
  scale_x_datetime(
    date_breaks = "12 hours", 
    labels = scales::label_date_short()
  ) +
  scale_y_continuous(
    breaks = scales::breaks_pretty()
  ) +
  facet_grid(
    group ~ class,
    scales = "free_y",
    labeller = "label_both"
  )

Tip

  • scales: are scales shared across all facets (the default, “fixed”), or do they vary across rows (“free_x”), columns (“free_y”), or both rows and columns (“free”)?

  • labeller default labeller (i.e., "label_value") labels the rows and columns with their names; "label_both" displays both the variable name and the factor value.

Customize metadata: primary labels

Now we can start to make it nicer, adding and improving some text and label, as the title, axis and legend labels, and a caption.

linelist |>  # start from data, and than 
  ggplot(  # create a plot
    aes(  # with aesthetics:
      x = onset_datetime
    )
  ) + 
  geom_bar(fill = "blue") +
  geom_bar(
    aes(fill = sex),
    position = "dodge"
  ) + 
  scale_x_datetime(
    date_breaks = "12 hours", 
    labels = scales::label_date_short()
  ) +
  scale_y_continuous(
    breaks = scales::breaks_pretty()
  ) +
  facet_grid(
    group ~ class,
    scales = "free_y"
  ) + 
  labs(
    ## aesthetics used titles
    x = "Onset date",
    y = "Count (N person)",
    fill = "Sex",
    ## plot metadata
    title = "Distribution of cases across days.",
    subtitle = "Stratified by group and class.",
    caption = "Data from ECDC EPIET Outbreak Investigation (https://github.com/EPIET/OutbreakInvestigation)."
  )

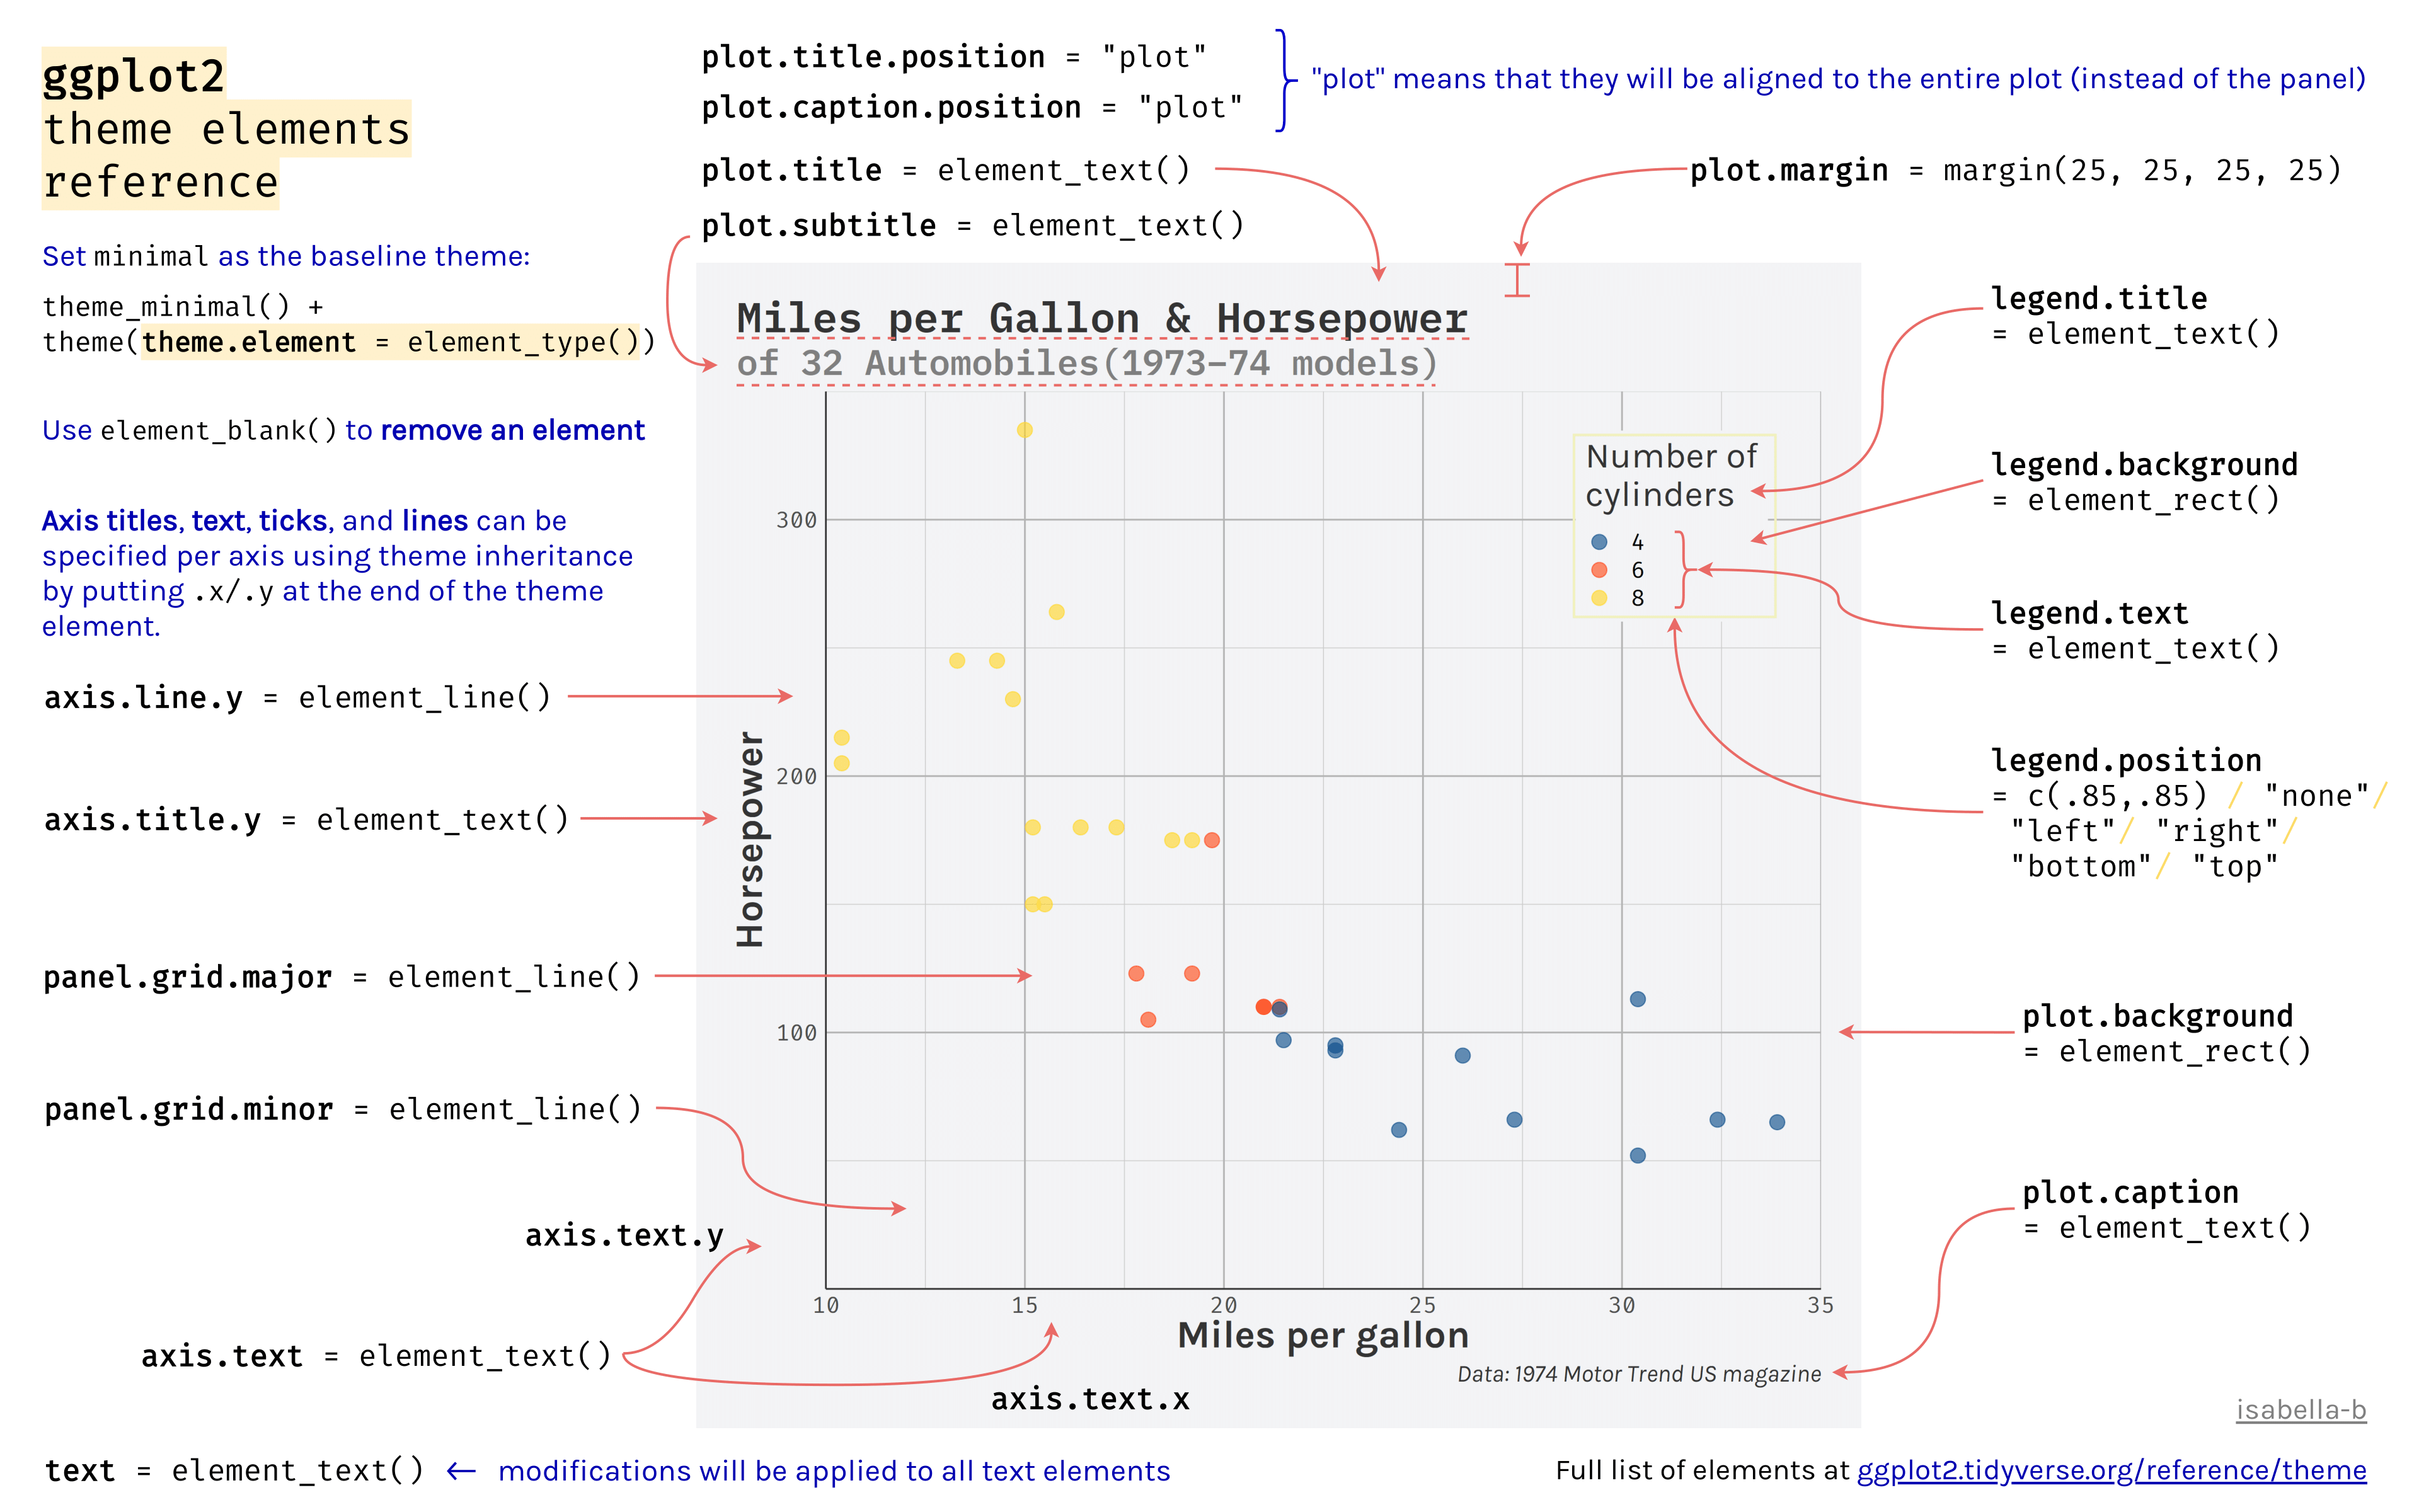
Theme (overview)

Many other options we can finally consider to fine tune the appearance of our plot.

linelist |>  # start from data, and than 
  ggplot(  # create a plot
    aes(  # with aesthetics:
      x = onset_datetime
    )
  ) + 
  geom_bar(fill = "blue") +
  geom_bar(
    aes(fill = sex),
    position = "dodge"
  ) + 
  scale_x_datetime(
    date_breaks = "12 hours", 
    labels = scales::label_date_short()
  ) +
  scale_y_continuous(
    breaks = scales::breaks_pretty()
  ) +
  facet_grid(
    group ~ class,
    scales = "free_y",
    labeller = "label_both"
  ) + 
  labs(
    ## aesthetics used titles
    x = "Onset date",
    y = "Count (N person)",
    fill = "Sex",
    ## plot metadata
    title = "Distribution of cases across days.",
    subtitle = "Stratified by group and class.",
    caption = "Data from ECDC EPIET Outbreak Investigation (https://github.com/EPIET/OutbreakInvestigation)."
  ) +
  theme_bw() +
  theme(
    legend.position = "top"
  )

Themes: showcase (overview)

Theme custom parameters are quite much, here we report a representation of a number of them.

Theme Elements Reference Sheet by Isabella Benabaye

A more complete template

We can finally have a bigger set of instructions to define a more exhaustive template for our plots.

<DATA> |> 
  ggplot(
    aes(<GLOBAL_MAPPINGS>)
  ) + 
    <GEOM_FUNCTION>(
      aes(<LOCAL_MAPPINGS>),
      position = <LOCAL_POSITION>,
      <AESTHETIC> = <LOCAL_CONSTANT>
    ) +
    <SCALE_FUNCTION> +
    <FACET_FUNCTION> +
    labs(
      ## aesthetics
      <AES_NAME> = "<TEXT>",
      
      ## meta-data
      <METADATA_NAME> = "<TEXT>"
    ) +
    <THEME>()

Saving plots

To save a ggplot on your disk, you can call the function ggsave. Many kind of output are supported.

epicurve <- linelist |> 
  ggplot(aes(...)) + 
  geom_bar(...) + 
  scales_x_datetime(...) +
  scales_y_continuous(...) +
  facet_grid(...) + 
  labs(...) + 
  theme(...)
ggsave("epicurve.pdf", plot = epicurve)
ggsave("epicurve.png", plot = epicurve)
ggsave("epicurve.jpeg", plot = epicurve)
ggsave("epicurve.tiff", plot = epicurve)
ggsave("epicurve.bmp", plot = epicurve)
ggsave("epicurve.svg", plot = epicurve)
ggsave("epicurve.eps", plot = epicurve)
ggsave("epicurve.ps", plot = epicurve)
ggsave("epicurve.tex", plot = epicurve)

Tip

  • The plot argument of ggsave is optional, if not specified the last plot created and displayed is saved!

  • The ggsave function guesses the type of graphics device from the extension of the filename.

Acknowledgment

To create the current lesson, we explored, used, and adapted content from the following resources:

The slides are made using Posit’s Quarto open-source scientific and technical publishing system powered in R by Yihui Xie’s Kintr.

Additional resources

License

This work by Corrado Lanera, Ileana Baldi, and Dario Gregori is licensed under CC BY 4.0

References